
Jiaqi Chen, BSc Economics, Finance and Data Science, Imperial College London
July 18, 2024
When exploring Game Theory in our Microeconomics lecture, the first year BSc Economics, Finance and Data Science cohort was given the opportunity to engage, through the Classex software (https://classex.uni-passau.de/bin/), in a real-life simulation of a repeated public goods game featured in Unit 4.8 of The Economy 2.0: Microeconomics ( https://www.core-econ.org/the-economy/microeconomics/04-strategic-interactions-06-public-good-games.html).
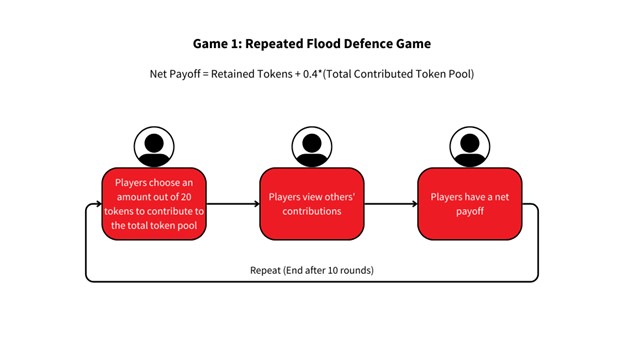
Figure 1. Procedure of Game 1: Repeated Flood Defence Game
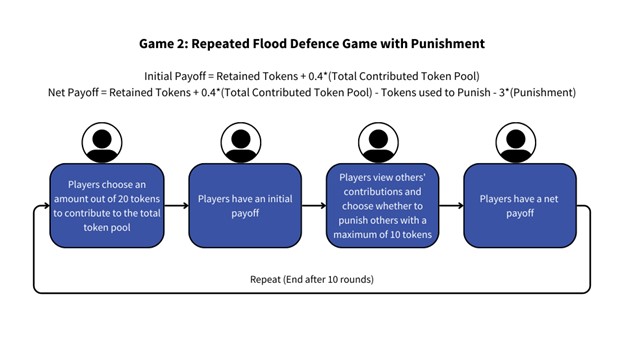
Figure 2. Procedure of Game 2: Repeated Flood Defence Game with Punishment
Randomly assigned to a group of four peers for the online game, we needed to make simultaneous decisions on our contribution to collective flood defence over 10 periods (Figure 1: Game 1). A subsequent mutated version of the game introduced the opportunity to “punish” others at the expense of our own payoffs (Figure 2: Game 2).
Immediately, my mind raced with the implications: repeated games will involve opportunities to react to or influence others, but others may also act unexpectedly. I found it impossible to rigorously follow an optimal strategy given the many rounds involved, the complexity of the payoff calculation, and the unpredictability of other players.
For Game 1, cautious and testing the waters, I decided to start out contributing half of my tokens. As the game progressed, others’ contributions increased, and I felt safe to increase my contribution as well. However, reaching the last few rounds, more players contributed less or did not contribute, prompting me to also decrease my contribution to avoid being exploited by free riders.
For Game 2, I was afraid of incurring punishment, so I continuously contributed more than in Game 1. Additionally, I actively punished those who contributed less than I did and was free riding on the contribution of others, to compel them to contribute more. While punishing others deducts from my own payoff, being able to retaliate against free riders brought me satisfaction, which may be an intangible payoff.
A course mate also revealed to me his amusing but rational strategy: he would always contribute all his tokens every round to influence others to follow him, and for select rounds betray them with zero contributions to reap the greatest payoff individually.
In the end, my course mate’s net payoff was higher for Game 1, while my net payoff was higher for Game 2.
After engaging in the games, the class was abuzz with discussion on how the outcomes of the repeated flood defence game deviated greatly from those theorised for a one-shot game. Material from Unit 4.6 of The Economy 2.0: Microeconomics predicts that in a one-shot public goods game, such as the flood defense game, players would prefer to free-ride on the pooled tokens from others and contribute nothing — a classic case of the Tragedy of the Commons. However, in this in-lecture session, most players were willing to chip into the total token pool.
Indeed, if all players in a group contributed all their tokens to the token pool (and nobody is punished), individual net payoffs would be higher than keeping all of one’s tokens, at 32 compared to 20. However, in a one-shot game, there is no basis to trust that other players are likely to contribute.
From course mates’ insightful sharings on their game experiences, it was evident that the institutional setup which mandated repeated interactions with the same people over many rounds enabled players to send signals, predict one another’s actions, and establish the trust needed to pool tokens to gain higher net payoffs. The added punishment mechanism provided assurance that if one player acts selfishly, they may incur greater losses than gains.
Subsequent tutorial work prompted me to conduct analysis on the data collected on the play of the whole cohort. The activity built on Unit 2 of Doing Economics (https://www.core-econ.org/doing-economics/book/text/02-03.html#part-22-describing-the-data), with some adaptation by my lecturer Prof Cloda Jenkins. Utilising R, I managed to plot diagrams that revealed insights on repeated games echoing economic theories from textbook and lecture materials.

Figure 3. Line Plot on the Mean Contribution by Players over 10 Rounds
However, amidst plotting the data, I found that groups of players acted very differently over the course of 10 rounds. Some groups saw consistently high contributions while others saw virtually none. While players’ actions varied, the overall mean contribution per round (Figure 3) could shed some light on any identifiable patterns of play for Games 1 and 2 over the 10 rounds. With 54 players in total, the calculated means are likely to be reliable and accurate.
For both game types, players started off contributing at about a midpoint as players gauge others’ preferences and strategies.
In Game 1, the mean contribution by players remains relatively constant, likely reflecting coordination and reciprocity following initial contribution patterns. Game 2 saw increasing contributions by players — players may have actively punished lower contributors and compelled them to follow a norm of higher contributions to increase their payoffs.
The mean contribution of players is consistently higher for Game 2 compared to Game 1. This could be due to players anticipating lower payoffs if they were to contribute less which invites punishment, or being irrationally loss averse.
At the end, which we all knew was the last round of the game, mean contributions decreased drastically for both game types. When there is a lack of future games and a lack of fear of future punishment, players are likely to treat the round as a one-shot game and reduce their contributions to free ride on others.
Tapping on statistical knowledge and generative technology for R code, I also conducted a hypothesis test on the significance of the difference between mean contributions for games with and without punishment, to determine if the punishment feature had a large impact on players’ willingness to contribute.
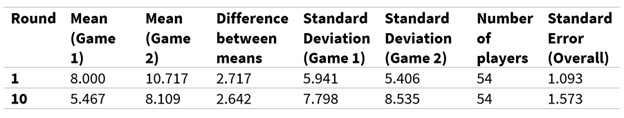
Table 1. Data Used for Hypothesis Test (3 Decimal Places)
Using data from Rounds 1 and 10 for Games 1 and 2 (Table 1), I tested if the difference in mean contributions deviated significantly from zero.
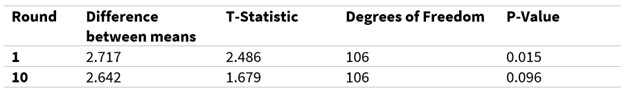
Table 2. Results of Hypothesis Test (3 Decimal Places)
The test revealed that for Round 1 (Table 2), we can be confident that the difference was significant (p-value = 0.015 < level of significance = 0.050), and the threat of punishment likely compelled players to start off contributing more.
For Round 10 (Table 2), we are less confident about the significance of the difference (level of significance = 0.050 < p-value = 0.096 < level of significance = 0.100). Confounding factors could have influenced the difference, such as the fact that players treated the last round differently from the other rounds in the game.
However, conclusions drawn from the data used may be limited. Collected from 54 course mates, the data lacks diversity as we may have similar preferences toward flood defence and punitive measures. In the real world, there may be vastly different attitudes and risk-profiles. Further experiments on a randomly selected larger and more diverse group of respondents could be beneficial in corroborating or refuting the conclusions drawn.
Additionally, as a first year, I have many more experimental methods and statistical tools of analysis to learn to conduct more rigorous and non-biased experiments and extract insights from the results. In the future, it could also be meaningful to investigate correlations between contributions to flood defense and the profiles of players, such as social preferences, socio-economic status, gender and more, to better predict the possible outcomes of the game.
In all, the in-lecture flood defence games were exciting and fun. Taking part as a player and conducting ex-post analysis greatly reinforced my learning. I experienced first-hand how my preferences would shape my game strategies, how taking note of others’ strategies led me to pick my best response, and how incorporating an additional rule to change the payoffs of the game (the ability to punish) could bring about greater cooperation for a collectively beneficial outcome. Lastly, the in-lecture games also enabled me to understand the importance of experimentation and empirical data for game theory analysis, as simple hypothetical models are limited in capturing the real world.
ANNEX
Editable Table 1:
| Round | Mean (Game 1) | Mean (Game 2) | Difference between means | Standard Deviation (Game 1) | Standard Deviation (Game 2) | Number of players | Standard Error (Overall) |
| 1 | 8.000 | 10.717 | 2.717 | 5.941 | 5.406 | 54 | 1.093 |
| 10 | 5.467 | 8.109 | 2.642 | 7.798 | 8.535 | 54 | 1.573 |
Editable Table 2:
| Round | Difference between means | T-Statistic | Degrees of Freedom | P-Value |
| 1 | 2.717 | 2.486 | 106 | 0.015 |
| 10 | 2.642 | 1.679 | 106 | 0.096 |
